Devel module provides dsm() and dpm() functions to output variables on the page for debugging Drupal. But if the problem is more complicated, then that's not sufficient. You can simplify debugging tremendously if you stop code execution using breakpoints and then execute the application one step at a time. All IDEs that support PHP debugging, such as Eclipse, Netbeans, PHPStorm, etc., provide the functionality to put breakpoints in the code. But it requires quite a bit of configuration to make it work. In this post, you will learn how to configure PHPStorm 9 to debug Drupal 8. By the end of this article, you will be able to stop code execution in PHPStorm by putting a breakpoint.

It is assumed that you have already installed Drupal 8 on your local system and you are able to open the site in your browser. In my case, the Drupal 8 site is available at http://localhost/drupal8.
1) Set up a project for Drupal 8 in PHPStorm
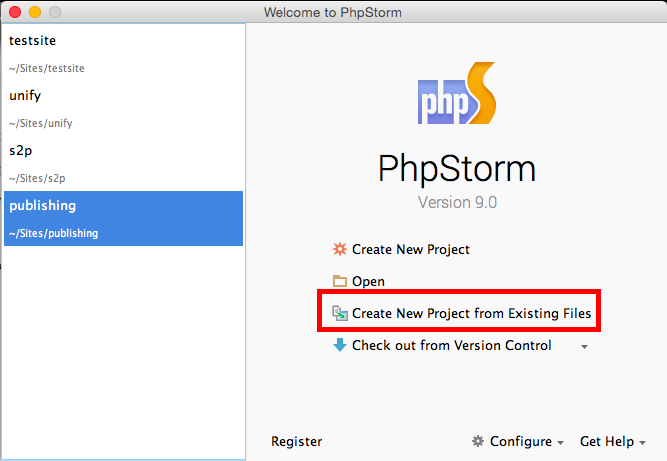
Open PHPStorm and select "Create New Project from Existing Files".
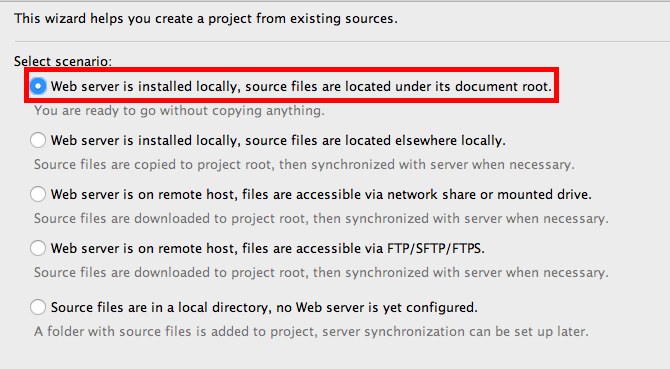
In the next screen, select "Web server is installed locally, source files are located under its document root." and press "Next".
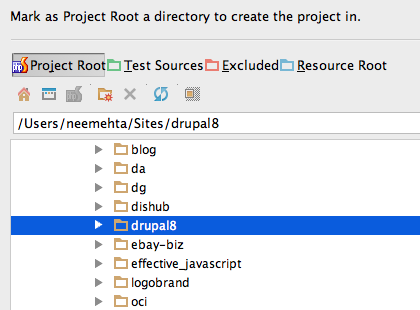
In the next step, PHPStorm will ask you to select the root folder of the Drupal 8 project. In my case, I have installed drupal in /Users/neemehta/Sites/drupal8 folder. So I will select this folder and then click on "Project Root" at the top. Click on "Next".
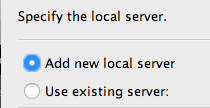
Now PHPStorm will ask you whether you want to use an existing server or a new server. If you have already used PHPStorm with other Drupal projects before, you will have an existing server. If this is the first time you are using PHPStorm, then you will need to add a new server. In this post, I'll show you how to add a new server. Click on "Add new local server" and then press "Next".
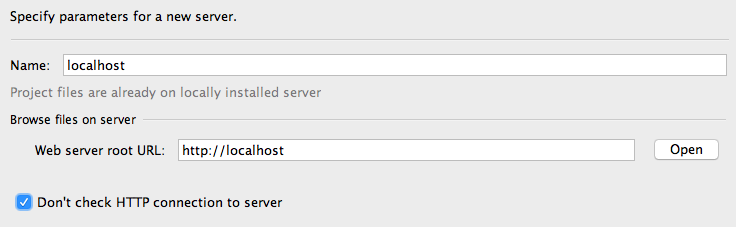
Fill in the server details. Enter name as "localhost" and Web server root URL as "http://localhost". Click on "Open" and you will see http://localhost in your broswer. It is possible that your Apache server may deny you access to http://localhost. In that case, make sure that you check "Don't check HTTP connection to server" checkbox before pressing "Next" otherwise PHPStorm will show you an error.
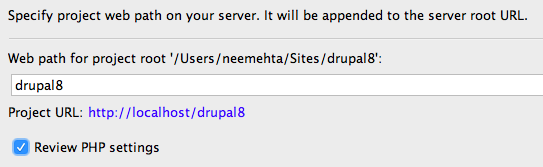
In the next step, you need to specify the web path where your Drupal 8 site will be accessible. In my case, it is accessible at http://localhost/drupal8 so I will enter Web path as "drupal8". An easy way to enter a value in this field is to make sure that the Project URL below the textfield points to the Drupal 8 site. Check "Review PHP settings" checkbox and press "Next".
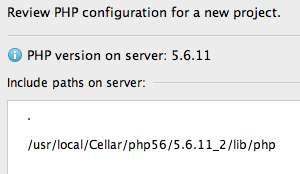
Make sure that PHPStorm is using the right version of PHP. If you have multiple versions of PHP installed on your system, then depending on the PATH environment variable, it is possible that PHPStorm may be using another version. If that is the case, make sure that the version of PHP that you want to use for Drupal 8, PHP 5.5 or 5.6, appears in the PATH variable before the other versions. Once the PHP version is correct, click on "Finish".
PHPStorm should now create a new project for your Drupal 8 site.
2) Configure PHPStorm to work with Drupal 8
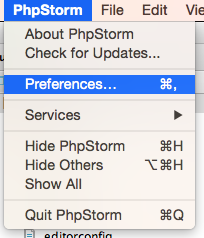
Open PHPStorm > Preferences menu item.
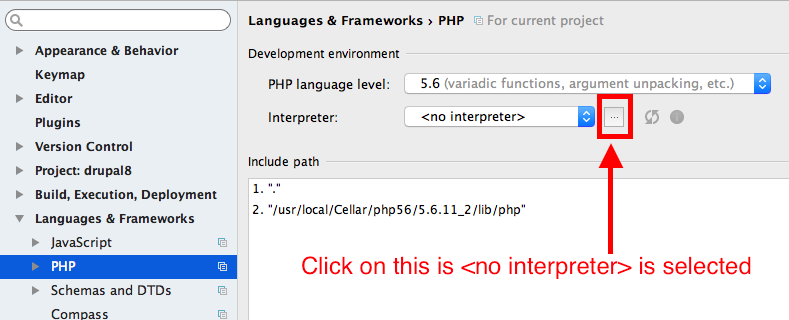
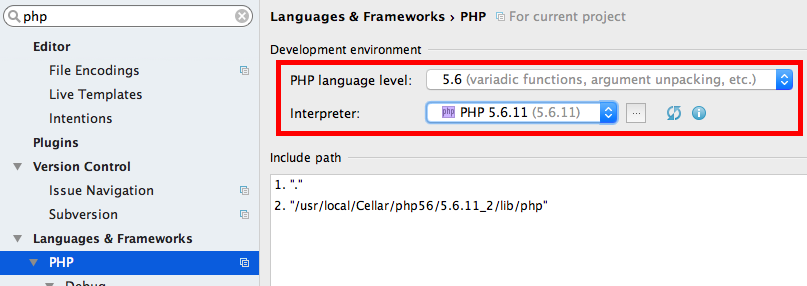
In the search box, type "php". You will see a bunch of results. Click on "Languages & Frameworks" > PHP. Select your PHP version in the "PHP language level" dropdown. Under Interpreter, you may see "<no interpreter>". If that is the case, select on the browse button right next to it.
In the next popup, click on the + icon in top left to add a new PHP interpreter. If the one you want already exists, then select it. If not, click on "Other Local". Add the PHP version you want to use for your Drupal 8 site and press OK.
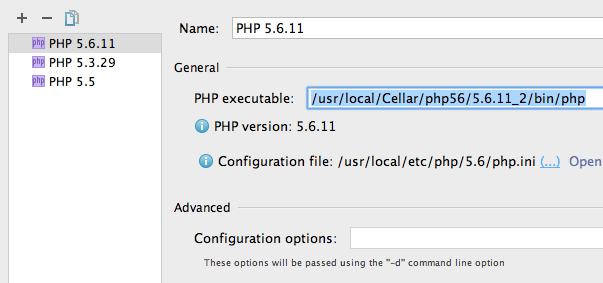
PHPStorm will take you back to the old popup. Make sure that the Interpreter dropdown has the version you selected. Press OK.
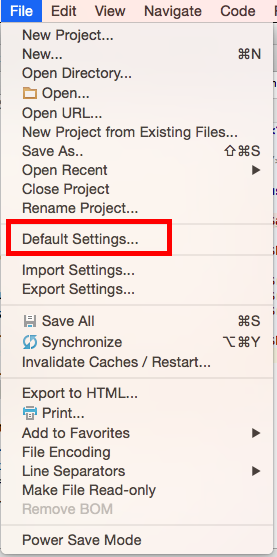
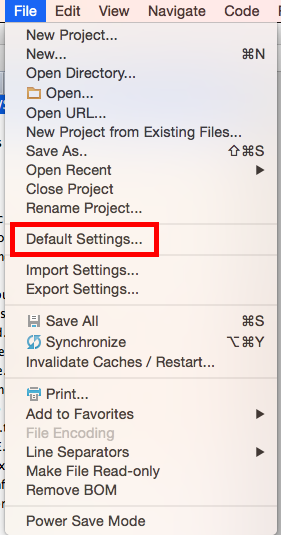
Open File > Default Settings menu item.
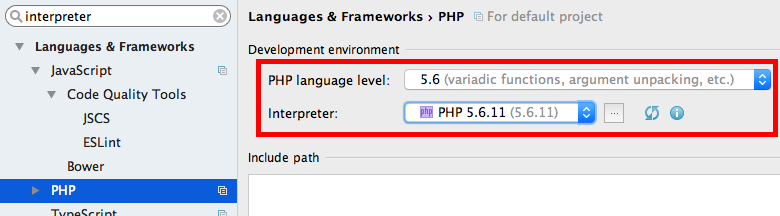
In search box, type "interpreter". Click on "Languages & Frameworks". In the right content area, make sure to select the correct version of PHP in "PHP language level" and Interpreter dropdowns.
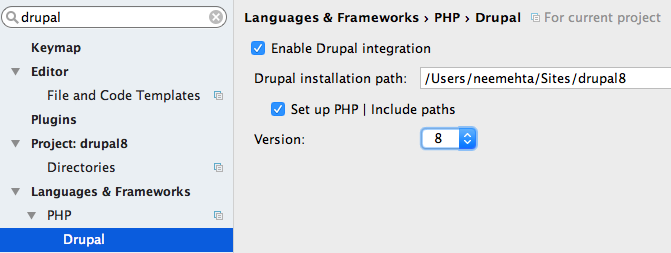
In the search box, type "drupal". Click on Languages & Frameworks > PHP > Drupal. Click on "Enable Drupal Integration" and set Drupal installation path to where you have drupal folder on your local drive. Keep "Set up PHP | Include paths" as checked. Under Version dropdown, select 8. Press "OK".
3) Install and configure xdebug
PHPStorm uses xdebug so first install it. Here are the instructions for installing xdebug on different operating systems:
Generally xdebug will generate its own xdebug.ini file. To find it, execute "locate xdebug.ini". Open that file. If you can not find the xdebug.ini file, then open php.ini file that your web server is using. Add the following to xdebug.ini:
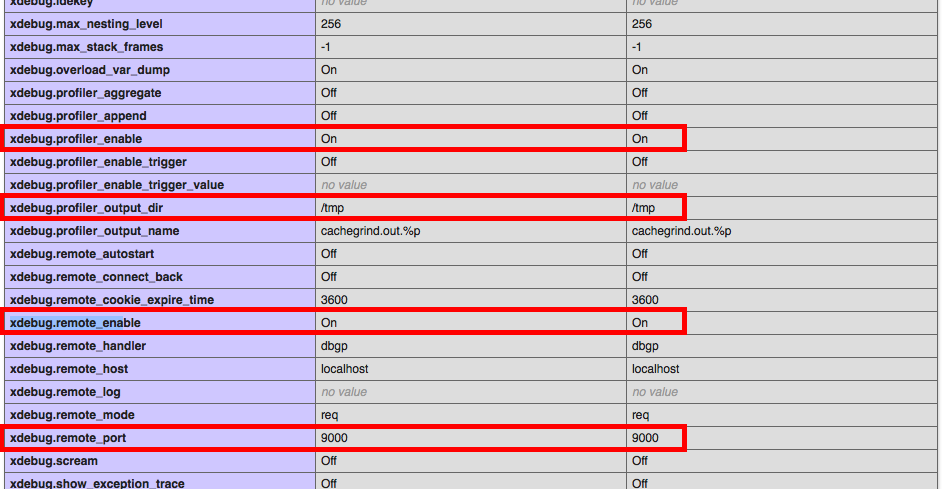
zend_extension="<Path to xdebug.so>"
xdebug.remote_enable=true
xdebug.remote_port="9000"
xdebug.profiler_enable=1
xdebug.profiler_output_dir="/tmp"
Restart the webserver and PHP-FPM service, if you are using it. Next go to your Drupal root folder and create a file named info.php. In this file, add the following:
<?php

phpinfo();

?>
Open this file in your browser. In my case, it is http://localhost/drupal8/info.php. You should be able to see information about the PHP version the webserver is using.
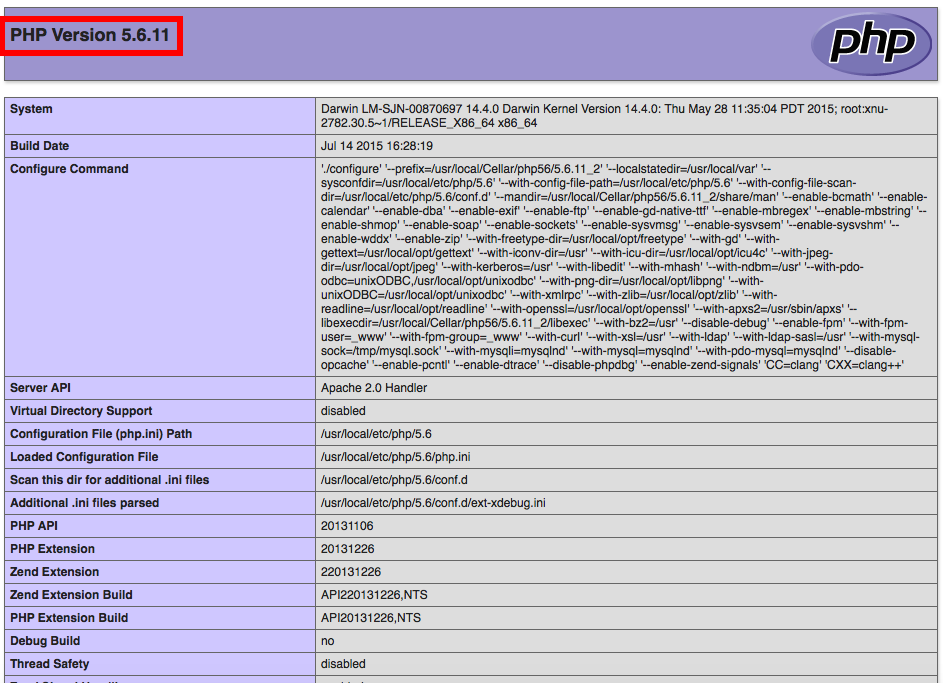
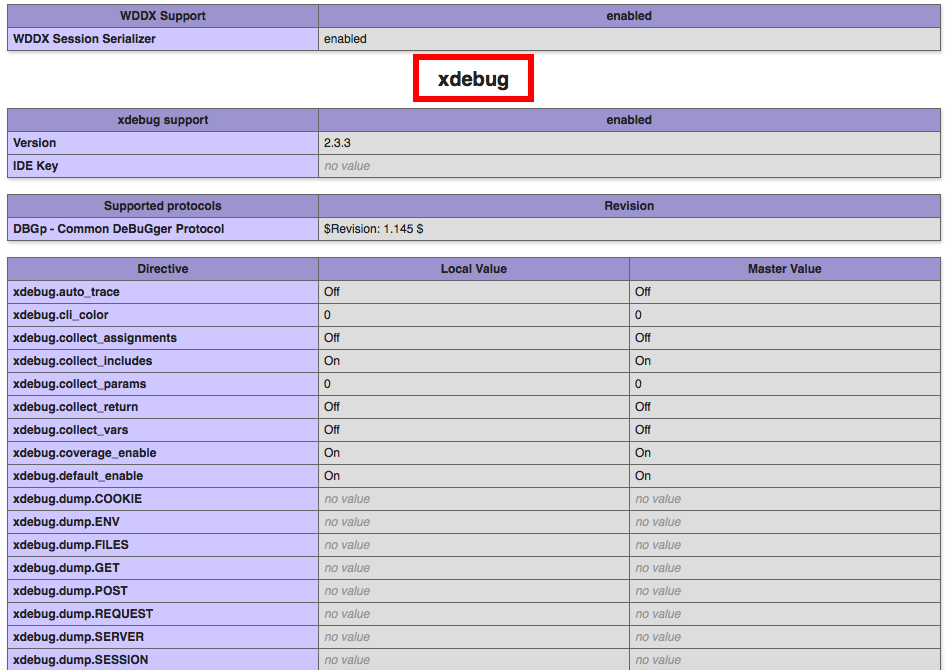
On this page, search for the term "xdebug". Make sure that you can find it. Verify that the page reflects the xdebug settings you entered in the xdebug.ini or php.ini file above.
4) Configure PHPStorm for debugging
Go to PHPStorm and open File > Default Settings menu item.
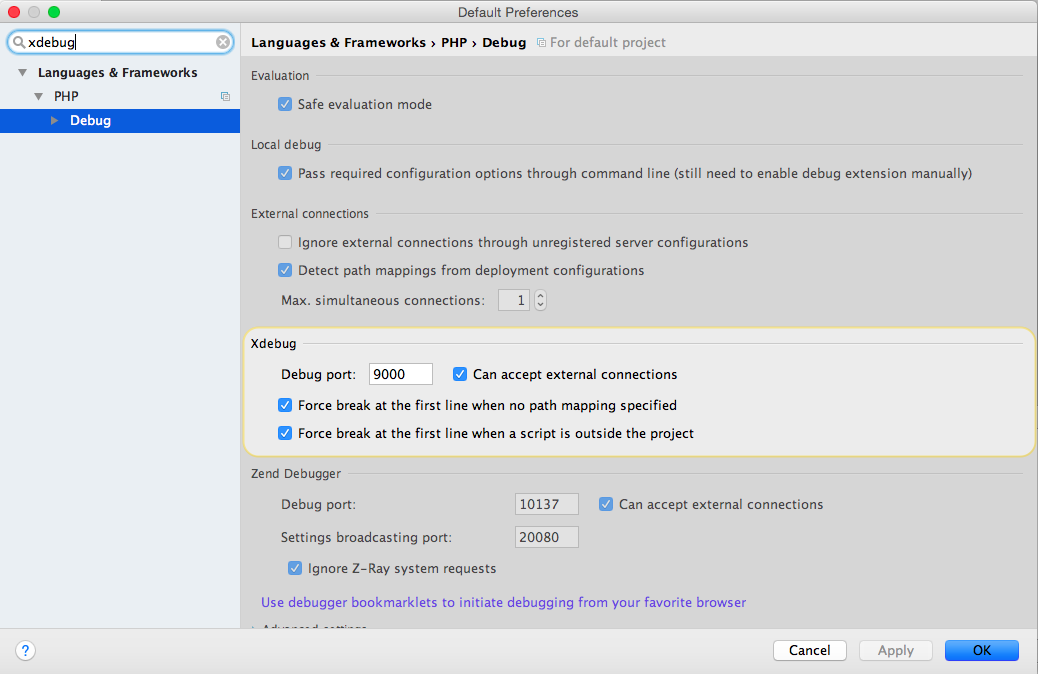
In the search field, enter "xdebug". Click on "Languages & Frameworks" > PHP > Debug. Under Xdebug section, make sure that the port is 9000. Press OK.
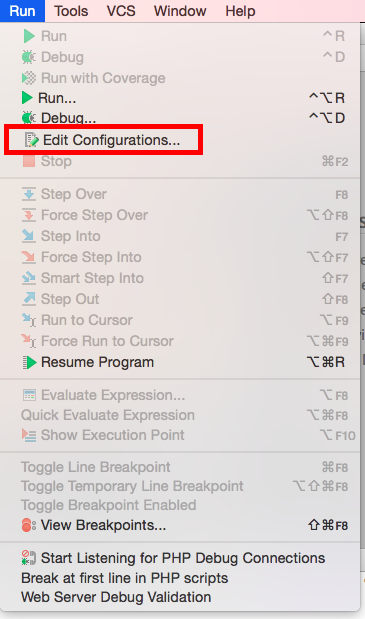
Open Run > Edit Configurations menu item.
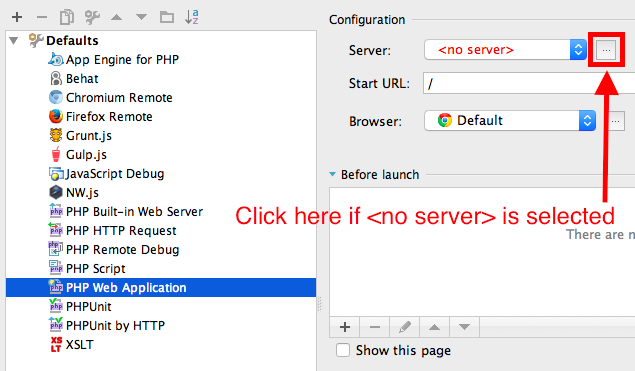
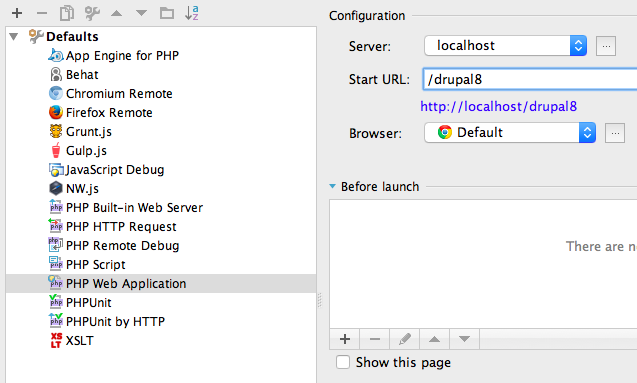
Open Defaults and click on "PHP Web Application". Then in the right content area, click on the browse button next to the Server field.
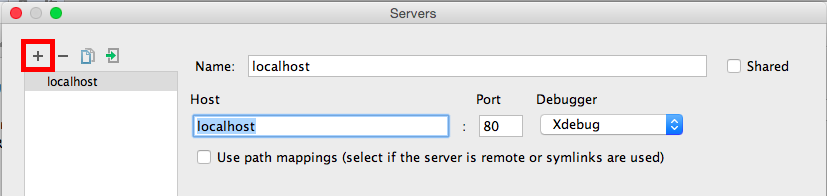
Next click on + icon to add a server. Name it "localhost" and specify host as "localhost" as well. Make sure that Debugger dropdown is set to "Xdebug". Press OK.
PHPStorm will now take you back to the previous popup. You will notice that Server dropdown has "localhost" selected. In Start URL textfield, enter the URL of Drupal 8 website. In my case, it is http://localhost/drupal8, so I will enter "drupal8". Press on "Apply".
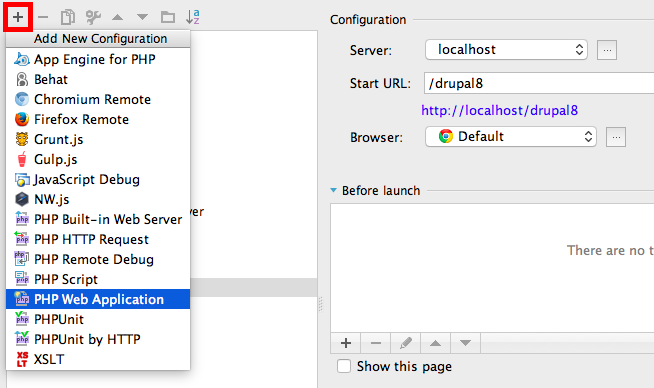
Next click the + icon in top left and select "PHP Web Application".
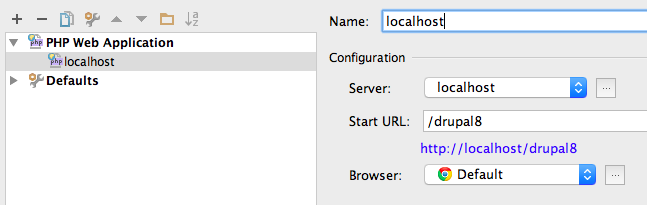
Enter Name as "localhost" and press OK.
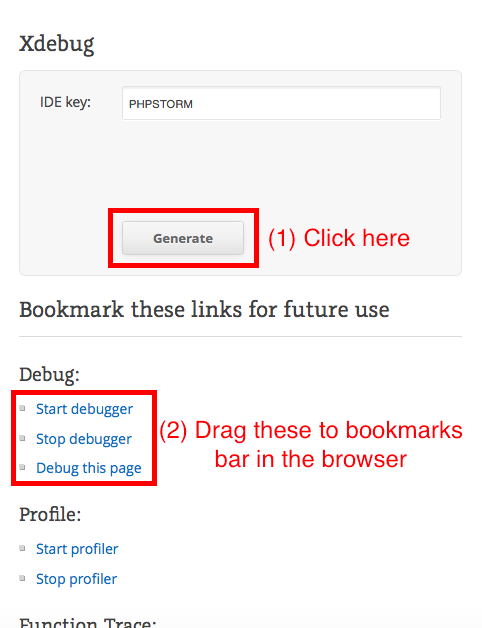
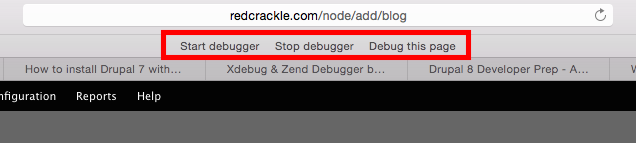
Go to https://www.jetbrains.com/phpstorm/marklets/ and click on "Generate" under Xdebug. You will see three links: "Start Debugger", "Stop Debugger" and "Debug this page". Drag and drop these in your bookmarks bar in the browser.
The above steps should have configured PHPStorm to work with Xdebug. You should now be able to put breakpoints in your Drupal 8 code and make the code execution stop for debugging. Let's give it a shot to see if it works.
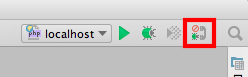
Go to PHPStorm and click on the icon in the top right to "Start Listening for PHP Debug Connections".
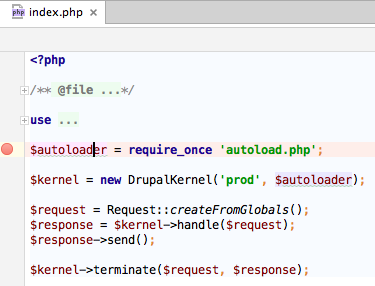
Open index.php file in PHPStorm and put a breakpoint on the following line:
$autoloader = require_once 'autoload.php';
You can easily put a breakpoint by clicking on the left of this link in PHPStorm.
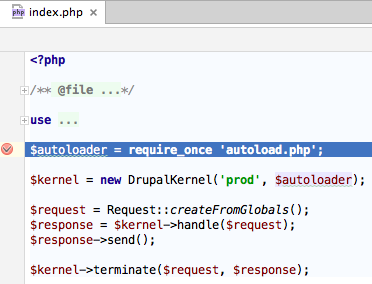
Go to the browser in which you added the debugging bookmarklets and open your Drupal 8 site. Click on "Start Debugger" bookmarklet and refresh the page. You should be able to see code execution stop in PHPStorm at the breakpoint you put.
Congratulations! You are well on your way to debug modules (yours as well as others') using this setup. If you feel I have missed out any step or you are stuck on one of the steps, let me know via the comments below and I'll help you.
Comments
Thanks. I think this is the
Thanks. I think this is the first time I have been able to get the Xdebug running on Windows :D
By the way I think you also need to set up the xdebug.idekey = "PHPSTORM" but maybe not, I am not sure..I did.
Good article, thanks. I've
Good article, thanks. I've been using phpStorm for the last few years, and have found it invaluable for theming, makes it so easier to see variables. But with Drupal 8, I'd love to be able to set a breakpoint within a twig file; is there anyway to do so?
Twig files don't execute PHP,
Twig files don't execute PHP, so I don't think you'll be able to step through them in a debugger.
Well technically if you
Well technically if you really wanted to, you could set a breakpoint in the compiled PHP class. every Twig file is compiled into a php class.
xdebug/phpstorm/drupal 8 /MAMP Pro
Greetings,
Thank you for your instructions how to set up phpstorm with drupal 8. I worked fine for me, and I followed your indications. However, there is a problem. I get the following error in the drupal status report:
"xdebug.max_nesting_level is set to 100.
Set xdebug.max_nesting_level=256 in your PHP configuration as some pages in your
Drupal site will not work when this setting is too low"
I tried in several ways to change the value by adding: 'xdebug.max_nesting_level=256' in '/Applications/MAMP/bin/php/php5.6.10/conf/php.ini ', no change.
[xdebug]
zend_extension="/Applications/MAMP/bin/php/php5.6.10/lib/php/extensions/no-debug-non-zts-20131226/xdebug.so"
xdebug.max_nesting_level=256
xdebug.default_enable=1
xdebug.remote_enable=true
xdebug.remote_port="9000"
xdebug.profiler_enable=1
xdebug.profiler_output_dir="/Applications/MAMP/tmp"
xdebug.profiler_enable is sett to 'off'
xdebug.max_nesting_level stays at 100.
Any idea what I am doing wrong. BTW, I am running MAMP Pro 3.5. The error let me run the site in 'Bartik' but not with another theme.
Thanks,
Roman
n1
Just wanted to let u know, that I have xdebug up and running. The other guides on Acquia and so on are missing the interpreter section and don´t make sure, xdebug is runnning.
One thing is that they say you should use a specific xdebug file in (dev Desktop) php.ini "php5_6/ext/php_xdebug-2.3.2-5.6-vc11.dll" which is wrong.
So for short:
Thank you, amazing! :-)
Lars
Codelobster
I prefer to use Codelobster for Drupal projects: http://codelobster.com/drupal.html