
Using Firebug or Chrome DevTools, It's very easy to put a breakpoint in a JS that is loaded during page load. But if you are loading a JS dynamically after the page load, it's not that simple. Today I learned a nice trick to make it easier to put a breakpoint in such a javascript using Chrome DevTools. Here are the steps:
1) At the bottom of the JS file that is being loaded dynamically, add the following line:
//# sourceURL=formEditor.js
formEditor.js is the name of the JS file I am adding to the page dynamically. Here is how the last line of the JS file will look:

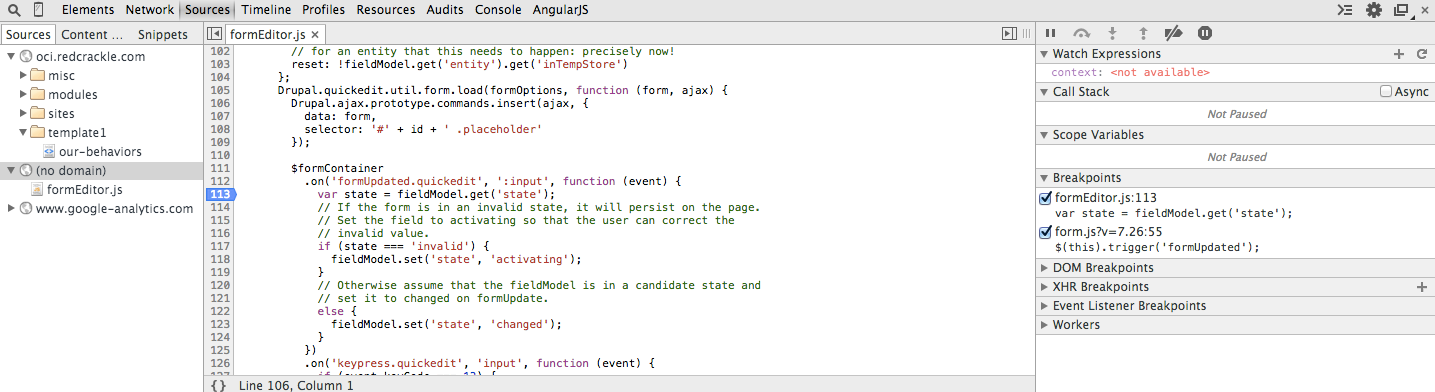
2) Reload the web page in Chrome and open DevTools. Now once the javascript gets loaded dynamically, you will be able to see it under (no domain) in Sources tab. You will be able to put a breakpoint in it. Next time you reload the page, code will stop at this breakpoint.

Comments
Awesome!
Thanks so much! This is just what I was looking for and it's so simple to enable.. :)
Thanks!